Governor Kathy Hochul today updated New Yorkers on the state’s progress combating COVID-19.
“With the holiday season upon us, I urge New Yorkers to take advantage of all available tools to keep themselves, their loved ones and their communities safe and healthy,” Governor Hochul said. “Stay up to date on vaccine doses, and test before gatherings or travel. If you test positive, talk to your doctor about potential treatment options.”
Governor Hochul is also urging New Yorkers to take common prevention measures – like staying up to date on vaccines and practicing proper hygiene – to protect from Respiratory Syncytial Virus (RSV), flu and COVID-19 and reduce the patient burden on local hospitals. Influenza is spreading quickly, with the number of laboratory-confirmed cases statewide and hospitalizations having spiked recently.
Governor Hochul previously launched a public awareness campaign featuring New York State Health Commissioner Dr. Mary T. Bassett speaking directly to New Yorkers about three viruses – RSV, flu and COVID-19 – now circulating in the state with similar symptoms and the potential to cause serious illness. Produced by the New York State Department of Health, the videos include a short clip and a longer version geared toward parents; and a version aimed specifically at health care providers.
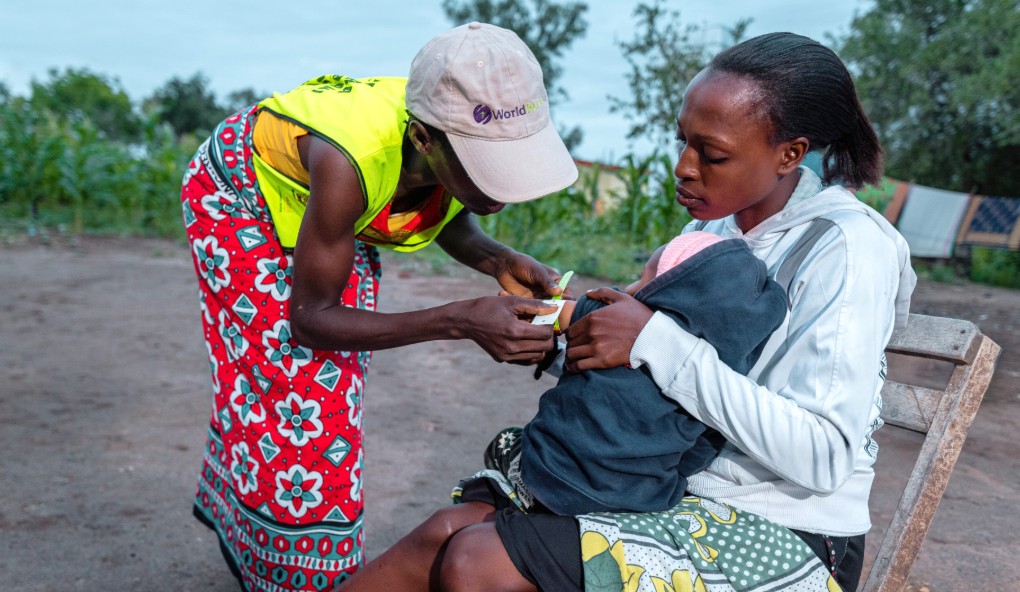
Governor Hochul continues to remind New Yorkers that children ages 5 and older may now receive the bivalent booster shots that are recommended to increase protection against COVID-19.
The Governor also urges New Yorkers to get their bivalent COVID-19 vaccine boosters. To schedule an appointment for a booster, New Yorkers should contact their local pharmacy, county health department, or healthcare provider; visit vaccines.gov; text their ZIP code to 438829, or call 1-800-232-0233 to find nearby locations.
In addition, Governor Hochul encourages New Yorkers to get their annual flu vaccine as flu season is widespread across New York State. The flu virus and the virus that causes COVID-19 are both circulating, so getting vaccinated against both is the best way to stay healthy and to avoid added stress to the health care system.
The State Department of Health is continuing its annual public education campaign, reminding adults and parents to get both flu and COVID-19 shots for themselves and children 6 months and older. Advertisements in both English and Spanish language began running last month.
For information about flu vaccine clinics, contact the local health department or visit vaccines.gov/find-vaccines/.
Today’s data is summarized briefly below:
- 7-Day Average Cases Per 100k – 28.00
- Test Results Reported – 43,658
- Total Positive – 3,314
- Percent Positive – 7.25{2c3a8711102f73ee058d83c6a8025dc7f37722aad075054eaafcf582b93871a0}**
- 7-Day Average Percent Positive – 7.16{2c3a8711102f73ee058d83c6a8025dc7f37722aad075054eaafcf582b93871a0}**
- Patient Hospitalization – 3,214 (-102)*
- Patients Newly Admitted – 522*
- Patients in ICU – 288 (0)*
- Patients in ICU with Intubation – 106 (-4)*
- Total Discharges – 368,796 (+560)*
- New deaths reported by healthcare facilities through HERDS – 30*
- Total deaths reported by healthcare facilities through HERDS – 59,548*
** Due to the test reporting policy change by the federal Department of Health and Human Services and several other factors, the most reliable metric to measure virus impact on a community is the case per 100,000 data — not percent positivity.
The Health Electronic Response Data System is a NYS DOH data source that collects confirmed daily death data as reported by hospitals, nursing homes and adult care facilities only.
Important Note: Effective Monday, April 4, the federal Department of Health and Human Services is no longer requiring testing facilities that use COVID-19 rapid antigen tests to report negative results. As a result, New York State’s percent positive metric will be computed using only lab-reported PCR results. Positive antigen tests will still be reported to New York State and reporting of new daily cases and cases per 100k will continue to include both PCR and antigen tests. Due to this change and other factors, including changes in testing practices, the most reliable metric to measure virus impact on a community is the case per 100,000 data — not percent positivity.
- Total deaths reported to and compiled by the CDC – 75,945
This daily COVID-19 provisional death certificate data reported by NYS DOH and NYC to the CDC includes those who died in any location, including hospitals, nursing homes, adult care facilities, at home, in hospice and other settings.
Each region’s 7-day average of cases per 100K population is as follows:
|
Region
|
Friday, December 2, 2022
|
Saturday, December 3, 2022
|
Sunday, December 4, 2022
|
|
Capital Region
|
13.01
|
13.46
|
13.87
|
|
Central New York
|
9.58
|
9.60
|
9.52
|
|
Finger Lakes
|
10.38
|
11.29
|
11.36
|
|
Long Island
|
40.24
|
41.43
|
42.40
|
|
Mid-Hudson
|
27.61
|
27.78
|
28.02
|
|
Mohawk Valley
|
9.10
|
10.30
|
9.98
|
|
New York City
|
33.69
|
34.64
|
34.74
|
|
North Country
|
11.70
|
12.21
|
12.21
|
|
Southern Tier
|
16.56
|
17.08
|
16.70
|
|
Western New York
|
9.74
|
9.94
|
9.61
|
|
Statewide
|
27.05
|
27.81
|
28.00
|
Each region’s 7-day average percentage of positive test results reported over the last three days is as follows**:
|
Region
|
Friday, December 2, 2022
|
Saturday, December 3, 2022
|
Sunday, December 4, 2022
|
|
Capital Region
|
5.82{2c3a8711102f73ee058d83c6a8025dc7f37722aad075054eaafcf582b93871a0}
|
5.80{2c3a8711102f73ee058d83c6a8025dc7f37722aad075054eaafcf582b93871a0}
|
6.01{2c3a8711102f73ee058d83c6a8025dc7f37722aad075054eaafcf582b93871a0}
|
|
Central New York
|
3.68{2c3a8711102f73ee058d83c6a8025dc7f37722aad075054eaafcf582b93871a0}
|
3.77{2c3a8711102f73ee058d83c6a8025dc7f37722aad075054eaafcf582b93871a0}
|
3.85{2c3a8711102f73ee058d83c6a8025dc7f37722aad075054eaafcf582b93871a0}
|
|
Finger Lakes
|
4.42{2c3a8711102f73ee058d83c6a8025dc7f37722aad075054eaafcf582b93871a0}
|
4.55{2c3a8711102f73ee058d83c6a8025dc7f37722aad075054eaafcf582b93871a0}
|
4.61{2c3a8711102f73ee058d83c6a8025dc7f37722aad075054eaafcf582b93871a0}
|
|
Long Island
|
8.68{2c3a8711102f73ee058d83c6a8025dc7f37722aad075054eaafcf582b93871a0}
|
8.70{2c3a8711102f73ee058d83c6a8025dc7f37722aad075054eaafcf582b93871a0}
|
8.76{2c3a8711102f73ee058d83c6a8025dc7f37722aad075054eaafcf582b93871a0}
|
|
Mid-Hudson
|
7.01{2c3a8711102f73ee058d83c6a8025dc7f37722aad075054eaafcf582b93871a0}
|
7.03{2c3a8711102f73ee058d83c6a8025dc7f37722aad075054eaafcf582b93871a0}
|
6.98{2c3a8711102f73ee058d83c6a8025dc7f37722aad075054eaafcf582b93871a0}
|
|
Mohawk Valley
|
4.01{2c3a8711102f73ee058d83c6a8025dc7f37722aad075054eaafcf582b93871a0}
|
4.15{2c3a8711102f73ee058d83c6a8025dc7f37722aad075054eaafcf582b93871a0}
|
3.93{2c3a8711102f73ee058d83c6a8025dc7f37722aad075054eaafcf582b93871a0}
|
|
New York City
|
7.63{2c3a8711102f73ee058d83c6a8025dc7f37722aad075054eaafcf582b93871a0}
|
7.56{2c3a8711102f73ee058d83c6a8025dc7f37722aad075054eaafcf582b93871a0}
|
7.54{2c3a8711102f73ee058d83c6a8025dc7f37722aad075054eaafcf582b93871a0}
|
|
North Country
|
5.61{2c3a8711102f73ee058d83c6a8025dc7f37722aad075054eaafcf582b93871a0}
|
5.81{2c3a8711102f73ee058d83c6a8025dc7f37722aad075054eaafcf582b93871a0}
|
5.67{2c3a8711102f73ee058d83c6a8025dc7f37722aad075054eaafcf582b93871a0}
|
|
Southern Tier
|
5.77{2c3a8711102f73ee058d83c6a8025dc7f37722aad075054eaafcf582b93871a0}
|
5.75{2c3a8711102f73ee058d83c6a8025dc7f37722aad075054eaafcf582b93871a0}
|
5.67{2c3a8711102f73ee058d83c6a8025dc7f37722aad075054eaafcf582b93871a0}
|
|
Western New York
|
6.80{2c3a8711102f73ee058d83c6a8025dc7f37722aad075054eaafcf582b93871a0}
|
6.72{2c3a8711102f73ee058d83c6a8025dc7f37722aad075054eaafcf582b93871a0}
|
6.55{2c3a8711102f73ee058d83c6a8025dc7f37722aad075054eaafcf582b93871a0}
|
|
Statewide
|
7.17{2c3a8711102f73ee058d83c6a8025dc7f37722aad075054eaafcf582b93871a0}
|
7.16{2c3a8711102f73ee058d83c6a8025dc7f37722aad075054eaafcf582b93871a0}
|
7.16{2c3a8711102f73ee058d83c6a8025dc7f37722aad075054eaafcf582b93871a0}
|
** Due to the test reporting policy change by the federal Department of Health and Human Services and several other factors, the most reliable metric to measure virus impact on a community is the case per 100,000 data — not percent positivity.
Each New York City borough’s 7-day average percentage of positive test results reported over the last three days is as follows **:
|
Borough in NYC
|
Friday, December 2, 2022
|
Saturday, December 3, 2022
|
Sunday, December 4, 2022
|
|
Bronx
|
7.96{2c3a8711102f73ee058d83c6a8025dc7f37722aad075054eaafcf582b93871a0}
|
7.99{2c3a8711102f73ee058d83c6a8025dc7f37722aad075054eaafcf582b93871a0}
|
8.05{2c3a8711102f73ee058d83c6a8025dc7f37722aad075054eaafcf582b93871a0}
|
|
Kings
|
6.92{2c3a8711102f73ee058d83c6a8025dc7f37722aad075054eaafcf582b93871a0}
|
6.88{2c3a8711102f73ee058d83c6a8025dc7f37722aad075054eaafcf582b93871a0}
|
6.92{2c3a8711102f73ee058d83c6a8025dc7f37722aad075054eaafcf582b93871a0}
|
|
New York
|
6.96{2c3a8711102f73ee058d83c6a8025dc7f37722aad075054eaafcf582b93871a0}
|
6.82{2c3a8711102f73ee058d83c6a8025dc7f37722aad075054eaafcf582b93871a0}
|
6.71{2c3a8711102f73ee058d83c6a8025dc7f37722aad075054eaafcf582b93871a0}
|
|
Queens
|
8.97{2c3a8711102f73ee058d83c6a8025dc7f37722aad075054eaafcf582b93871a0}
|
8.89{2c3a8711102f73ee058d83c6a8025dc7f37722aad075054eaafcf582b93871a0}
|
8.83{2c3a8711102f73ee058d83c6a8025dc7f37722aad075054eaafcf582b93871a0}
|
|
Richmond
|
6.88{2c3a8711102f73ee058d83c6a8025dc7f37722aad075054eaafcf582b93871a0}
|
6.79{2c3a8711102f73ee058d83c6a8025dc7f37722aad075054eaafcf582b93871a0}
|
6.67{2c3a8711102f73ee058d83c6a8025dc7f37722aad075054eaafcf582b93871a0}
|
** Due to the test reporting policy change by the federal Department of Health and Human Services and several other factors, the most reliable metric to measure virus impact on a community is the case per 100,000 data — not percent positivity.
Yesterday, 3,314 New Yorkers tested positive for COVID-19 in New York State, bringing the total to 6,306,574. A geographic breakdown is as follows:
|
County
|
Total Positive
|
New Positive
|
|
Albany
|
75,877
|
28
|
|
Allegany
|
10,446
|
2
|
|
Broome
|
56,585
|
15
|
|
Cattaraugus
|
18,700
|
1
|
|
Cayuga
|
19,708
|
4
|
|
Chautauqua
|
28,480
|
4
|
|
Chemung
|
25,929
|
9
|
|
Chenango
|
11,475
|
5
|
|
Clinton
|
21,654
|
7
|
|
Columbia
|
13,174
|
5
|
|
Cortland
|
12,894
|
1
|
|
Delaware
|
9,730
|
2
|
|
Dutchess
|
80,618
|
74
|
|
Erie
|
260,079
|
60
|
|
Essex
|
7,367
|
3
|
|
Franklin
|
11,710
|
4
|
|
Fulton
|
16,027
|
2
|
|
Genesee
|
16,094
|
2
|
|
Greene
|
10,481
|
5
|
|
Hamilton
|
1,061
|
4
|
|
Herkimer
|
16,927
|
2
|
|
Jefferson
|
25,801
|
8
|
|
Lewis
|
7,106
|
1
|
|
Livingston
|
13,942
|
5
|
|
Madison
|
16,302
|
7
|
|
Monroe
|
185,251
|
67
|
|
Montgomery
|
14,536
|
2
|
|
Nassau
|
521,414
|
403
|
|
Niagara
|
57,773
|
4
|
|
NYC
|
2,938,783
|
1,738
|
|
Oneida
|
66,662
|
8
|
|
Onondaga
|
138,155
|
22
|
|
Ontario
|
25,127
|
19
|
|
Orange
|
132,172
|
64
|
|
Orleans
|
10,192
|
2
|
|
Oswego
|
33,361
|
3
|
|
Otsego
|
12,790
|
6
|
|
Putnam
|
29,977
|
12
|
|
Rensselaer
|
40,367
|
21
|
|
Rockland
|
113,217
|
43
|
|
Saratoga
|
59,301
|
25
|
|
Schenectady
|
42,089
|
21
|
|
Schoharie
|
6,348
|
3
|
|
Schuyler
|
4,232
|
–
|
|
Seneca
|
7,366
|
1
|
|
St. Lawrence
|
25,582
|
2
|
|
Steuben
|
24,571
|
11
|
|
Suffolk
|
538,367
|
351
|
|
Sullivan
|
23,386
|
12
|
|
Tioga
|
13,606
|
5
|
|
Tompkins
|
25,649
|
5
|
|
Ulster
|
41,043
|
29
|
|
Warren
|
18,136
|
9
|
|
Washington
|
15,161
|
7
|
|
Wayne
|
21,127
|
10
|
|
Westchester
|
318,650
|
147
|
|
Wyoming
|
9,715
|
1
|
|
Yates
|
4,301
|
1
|
Below is data that shows how many hospitalized individuals who have tested positive for COVID-19 were admitted for COVID-19/COVID-19 complications and how many were admitted for non-COVID-19 conditions:
|
Region
|
COVID-19 Patients currently hospitalized
|
Admitted due to COVID or complications of COVID
|
{2c3a8711102f73ee058d83c6a8025dc7f37722aad075054eaafcf582b93871a0} Admitted due to COVID or complications of COVID
|
Admitted where COVID was not included as one of the reasons for admission
|
{2c3a8711102f73ee058d83c6a8025dc7f37722aad075054eaafcf582b93871a0} Admitted where COVID was not included as one of the reasons for admission
|
|
Capital Region
|
106
|
72
|
67.9{2c3a8711102f73ee058d83c6a8025dc7f37722aad075054eaafcf582b93871a0}
|
34
|
32.1{2c3a8711102f73ee058d83c6a8025dc7f37722aad075054eaafcf582b93871a0}
|
|
Central New York
|
61
|
30
|
49.2{2c3a8711102f73ee058d83c6a8025dc7f37722aad075054eaafcf582b93871a0}
|
31
|
50.8{2c3a8711102f73ee058d83c6a8025dc7f37722aad075054eaafcf582b93871a0}
|
|
Finger Lakes
|
251
|
60
|
23.9{2c3a8711102f73ee058d83c6a8025dc7f37722aad075054eaafcf582b93871a0}
|
191
|
76.1{2c3a8711102f73ee058d83c6a8025dc7f37722aad075054eaafcf582b93871a0}
|
|
Long Island
|
627
|
313
|
49.9{2c3a8711102f73ee058d83c6a8025dc7f37722aad075054eaafcf582b93871a0}
|
314
|
50.1{2c3a8711102f73ee058d83c6a8025dc7f37722aad075054eaafcf582b93871a0}
|
|
Mid-Hudson
|
353
|
171
|
48.4{2c3a8711102f73ee058d83c6a8025dc7f37722aad075054eaafcf582b93871a0}
|
182
|
51.6{2c3a8711102f73ee058d83c6a8025dc7f37722aad075054eaafcf582b93871a0}
|
|
Mohawk Valley
|
28
|
19
|
67.9{2c3a8711102f73ee058d83c6a8025dc7f37722aad075054eaafcf582b93871a0}
|
9
|
32.1{2c3a8711102f73ee058d83c6a8025dc7f37722aad075054eaafcf582b93871a0}
|
|
New York City
|
1,519
|
629
|
41.4{2c3a8711102f73ee058d83c6a8025dc7f37722aad075054eaafcf582b93871a0}
|
890
|
58.6{2c3a8711102f73ee058d83c6a8025dc7f37722aad075054eaafcf582b93871a0}
|
|
North Country
|
55
|
26
|
47.3{2c3a8711102f73ee058d83c6a8025dc7f37722aad075054eaafcf582b93871a0}
|
29
|
52.7{2c3a8711102f73ee058d83c6a8025dc7f37722aad075054eaafcf582b93871a0}
|
|
Southern Tier
|
91
|
25
|
27.5{2c3a8711102f73ee058d83c6a8025dc7f37722aad075054eaafcf582b93871a0}
|
66
|
72.5{2c3a8711102f73ee058d83c6a8025dc7f37722aad075054eaafcf582b93871a0}
|
|
Western New York
|
123
|
41
|
33.3{2c3a8711102f73ee058d83c6a8025dc7f37722aad075054eaafcf582b93871a0}
|
82
|
66.7{2c3a8711102f73ee058d83c6a8025dc7f37722aad075054eaafcf582b93871a0}
|
|
Statewide
|
3,214
|
1,386
|
43.1{2c3a8711102f73ee058d83c6a8025dc7f37722aad075054eaafcf582b93871a0}
|
1,828
|
56.9{2c3a8711102f73ee058d83c6a8025dc7f37722aad075054eaafcf582b93871a0}
|
The Omicron variant now represents more than 95{2c3a8711102f73ee058d83c6a8025dc7f37722aad075054eaafcf582b93871a0} of the viruses in circulation. For more information on variant tracking, please visit here: COVID-19 Variant Data | Department of Health (ny.gov).
On December 2, there were 30 total new deaths were reported due to COVID-19, bringing the total to 59,548. A geographic breakdown is as follows, by county of residence:
|
County
|
New Deaths
|
|
Bronx
|
2
|
|
Chautauqua
|
1
|
|
Chenango
|
1
|
|
Dutchess
|
1
|
|
Erie
|
1
|
|
Franklin
|
1
|
|
Greene
|
2
|
|
Kings
|
2
|
|
Monroe
|
2
|
|
Nassau
|
3
|
|
New York
|
2
|
|
Onondaga
|
2
|
|
Queens
|
5
|
|
Suffolk
|
4
|
|
Westchester
|
1
|
|
Grand Total
|
30
|
Important Note: HERDS data collection from health care facilities is not currently required on weekends or holidays. The survey will resume today and the facility/death data will be displayed in tomorrow’s report.
New Yorkers looking to schedule vaccine appointments for 5-11-year-old children are encouraged to contact their child’s pediatrician, family physician, county health departments, Federally Qualified Health Centers, rural health centers, or pharmacies that may be administering the vaccine for this age group. Parents and guardians can visit vaccines.gov, text their ZIP code to 438829, or call 1-800-232-0233 to find nearby locations. Make sure that the provider offers the Pfizer-BioNTechCOVID-19 vaccine, as the other COVID-19 vaccines are not yet authorized for this age group.
Visit our website for parents and guardians for new information, frequently asked questions and answers, and resources specifically designed for parents and guardians of this age group.